Urban Tree Canopy and Tree Equity using Satellite Data
Research has shown how urban forests have a number of social, environmental and economic benefits in cities. They will play an important role in climate change adaptation in urban areas.
Advancements and access to earth observation satellite data as well as LiDAR technology has made it possible to analyze a wide range or parameters when it comes to urban livability. One such area is urban tree cover which will become an increasingly critical way by which we assess climate change adaptation in cities. In this post I use three different datasets to explore urban tree canopy cover in Calgary. Situated in prairie grassland, the growth of urban trees in Calgary is challenging; there has been discussion in recent years about the loss of greenness, and tree equity in the NE quadrant (which also happens to have the highest immigrant population), pointing to the need for accurate and accessible data to assess tree canopy cover.
Mapping Trees
It’s common for medium to large cities in North America to maintain inventories of public, and some private, trees with detailed records of various characteristics including species or diameter at breast height (DBH). Some cities like Calgary also release canopy cover data which are derived from LiDAR instruments that measure the height of physical features on the ground such as buildings, trees or vegetation. These data sources provide valuable information about the urban forest and whether tree cover targets are being met.
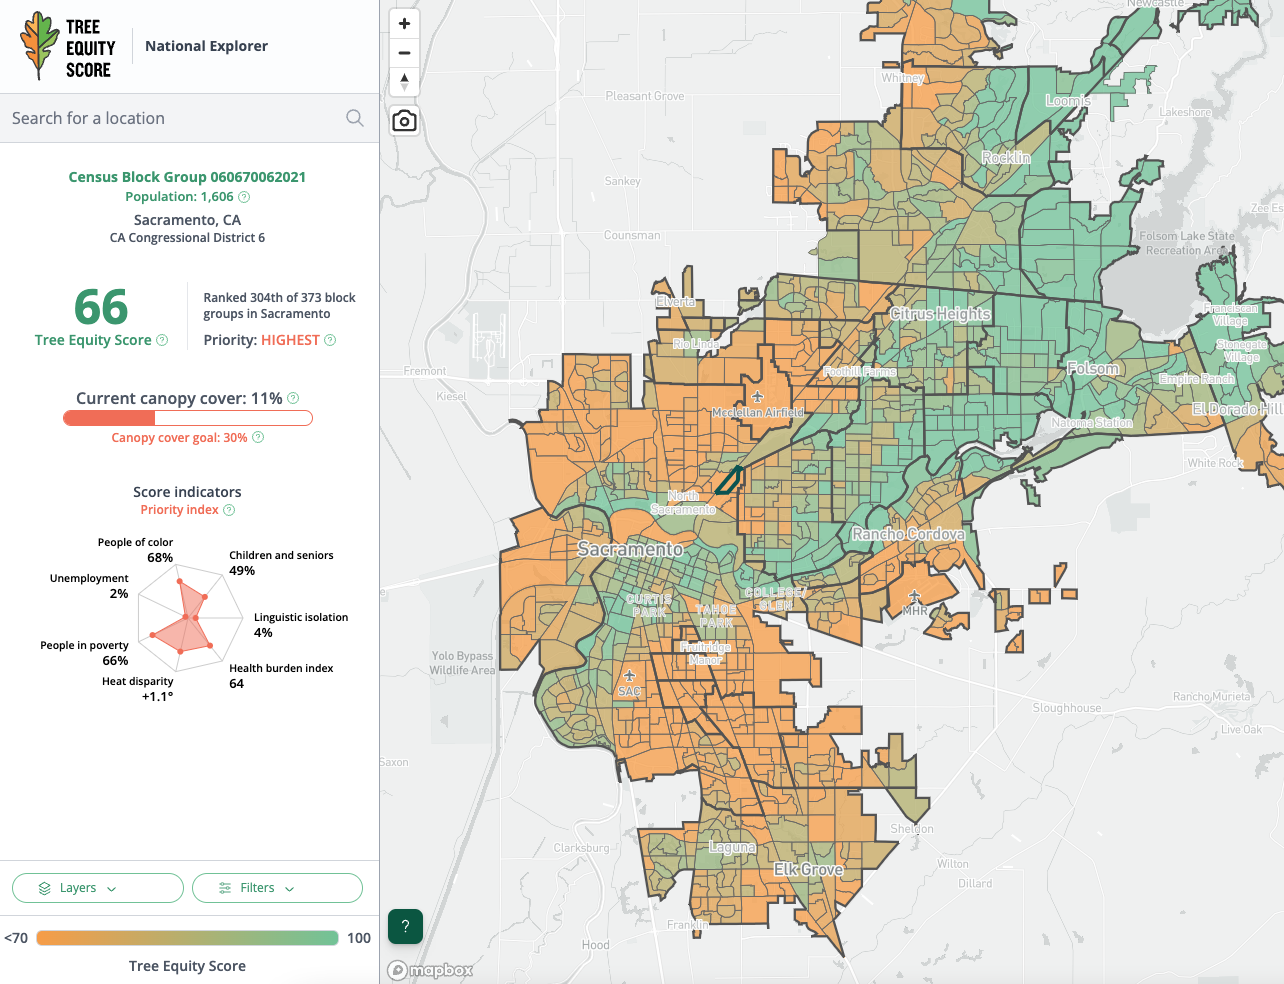
The US Tree Equity Score map may be the most comprehensive analysis of satellite imagery and census data relating to tree equity. Developed by American Forests and other partners, it uses a combination of high resolution tree canopy data and census data to score access and benefits of trees at a local level. This can ultimately be used to guide investment in tree infrastructure in areas that need it the most. Canada currently does not have a similar national Tree Equity map despite the federal government’s wide reaching 2 billion trees program. The Canadian Institute of Forestry has been working to address this by collaborating with a number of partners, including some of my old colleagues at Sparkgeo, to develop a national database on urban forestry geospatial data. Having accurate, up to date urban tree cover data would help greatly in allocating resources for tree planting programs like 2 Billion Trees.
Urban Design and the Benefits of Urban Tree Cover
Research has shown how urban forests have a number of social, environmental and economic benefits in cities. There has been increasing attention lately to urban tree cover and how it relates to social equity and climate resilience. Urban trees reduce heat island effect through passive cooling, improve stormwater management and storm surges, improve property values and have many public health benefits that generally support an improved quality of life for communities. They play an important role in climate change adaptation in urban areas (Dandridge, 2023).
The way cities and neighbourhoods are designed play a crucial part in this level of potential adaptation. In the case of Calgary, new suburban developments built on prairie grassland lack the natural ecosystem to support dense tree cover and therefore require careful planning of infrastructure and maintenance around trees. Unfortunately, modern subdivision developers are more concerned with rapidly building out, leaving tree planting as an afterthought. More often than not, this kind of development practice is often supported by public planning policy. We can see how subdivisions lack permeable surfaces, or adequate top soil depths that are needed for healthy tree growth. Therefore there is a marked difference in the tree canopy cover in different parts of the city, with some low income, immigrant communities with tree cover at effectively 0%!
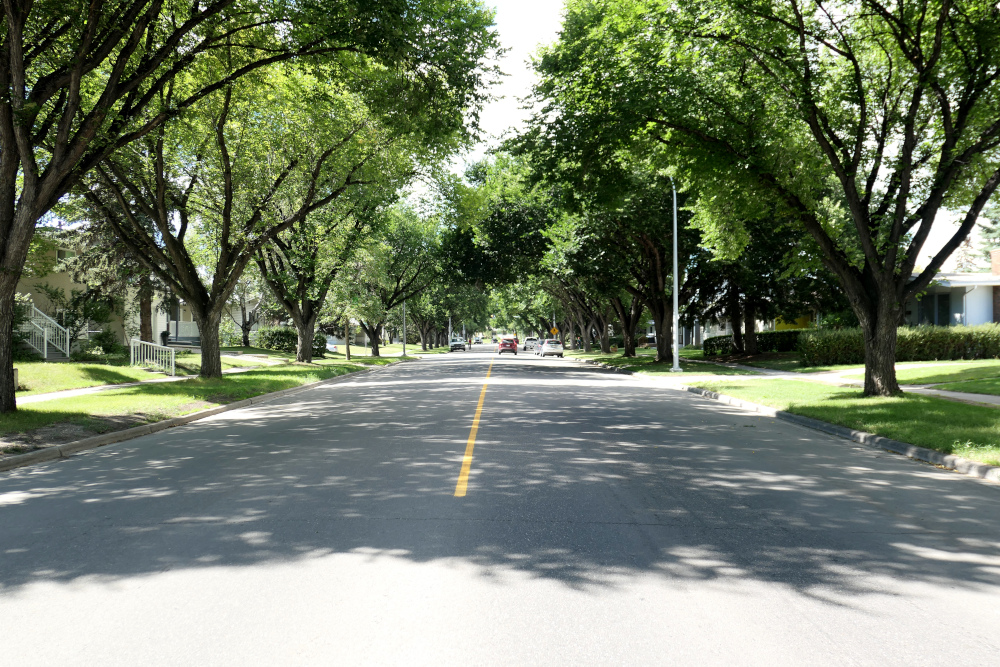 Post WWII developments in Calgary (Normount Drive shown above), although car centric with wide vehicle travel lanes, are able to support impressive tree growth because of sufficient permeable surfaces from large front lawns and lots.
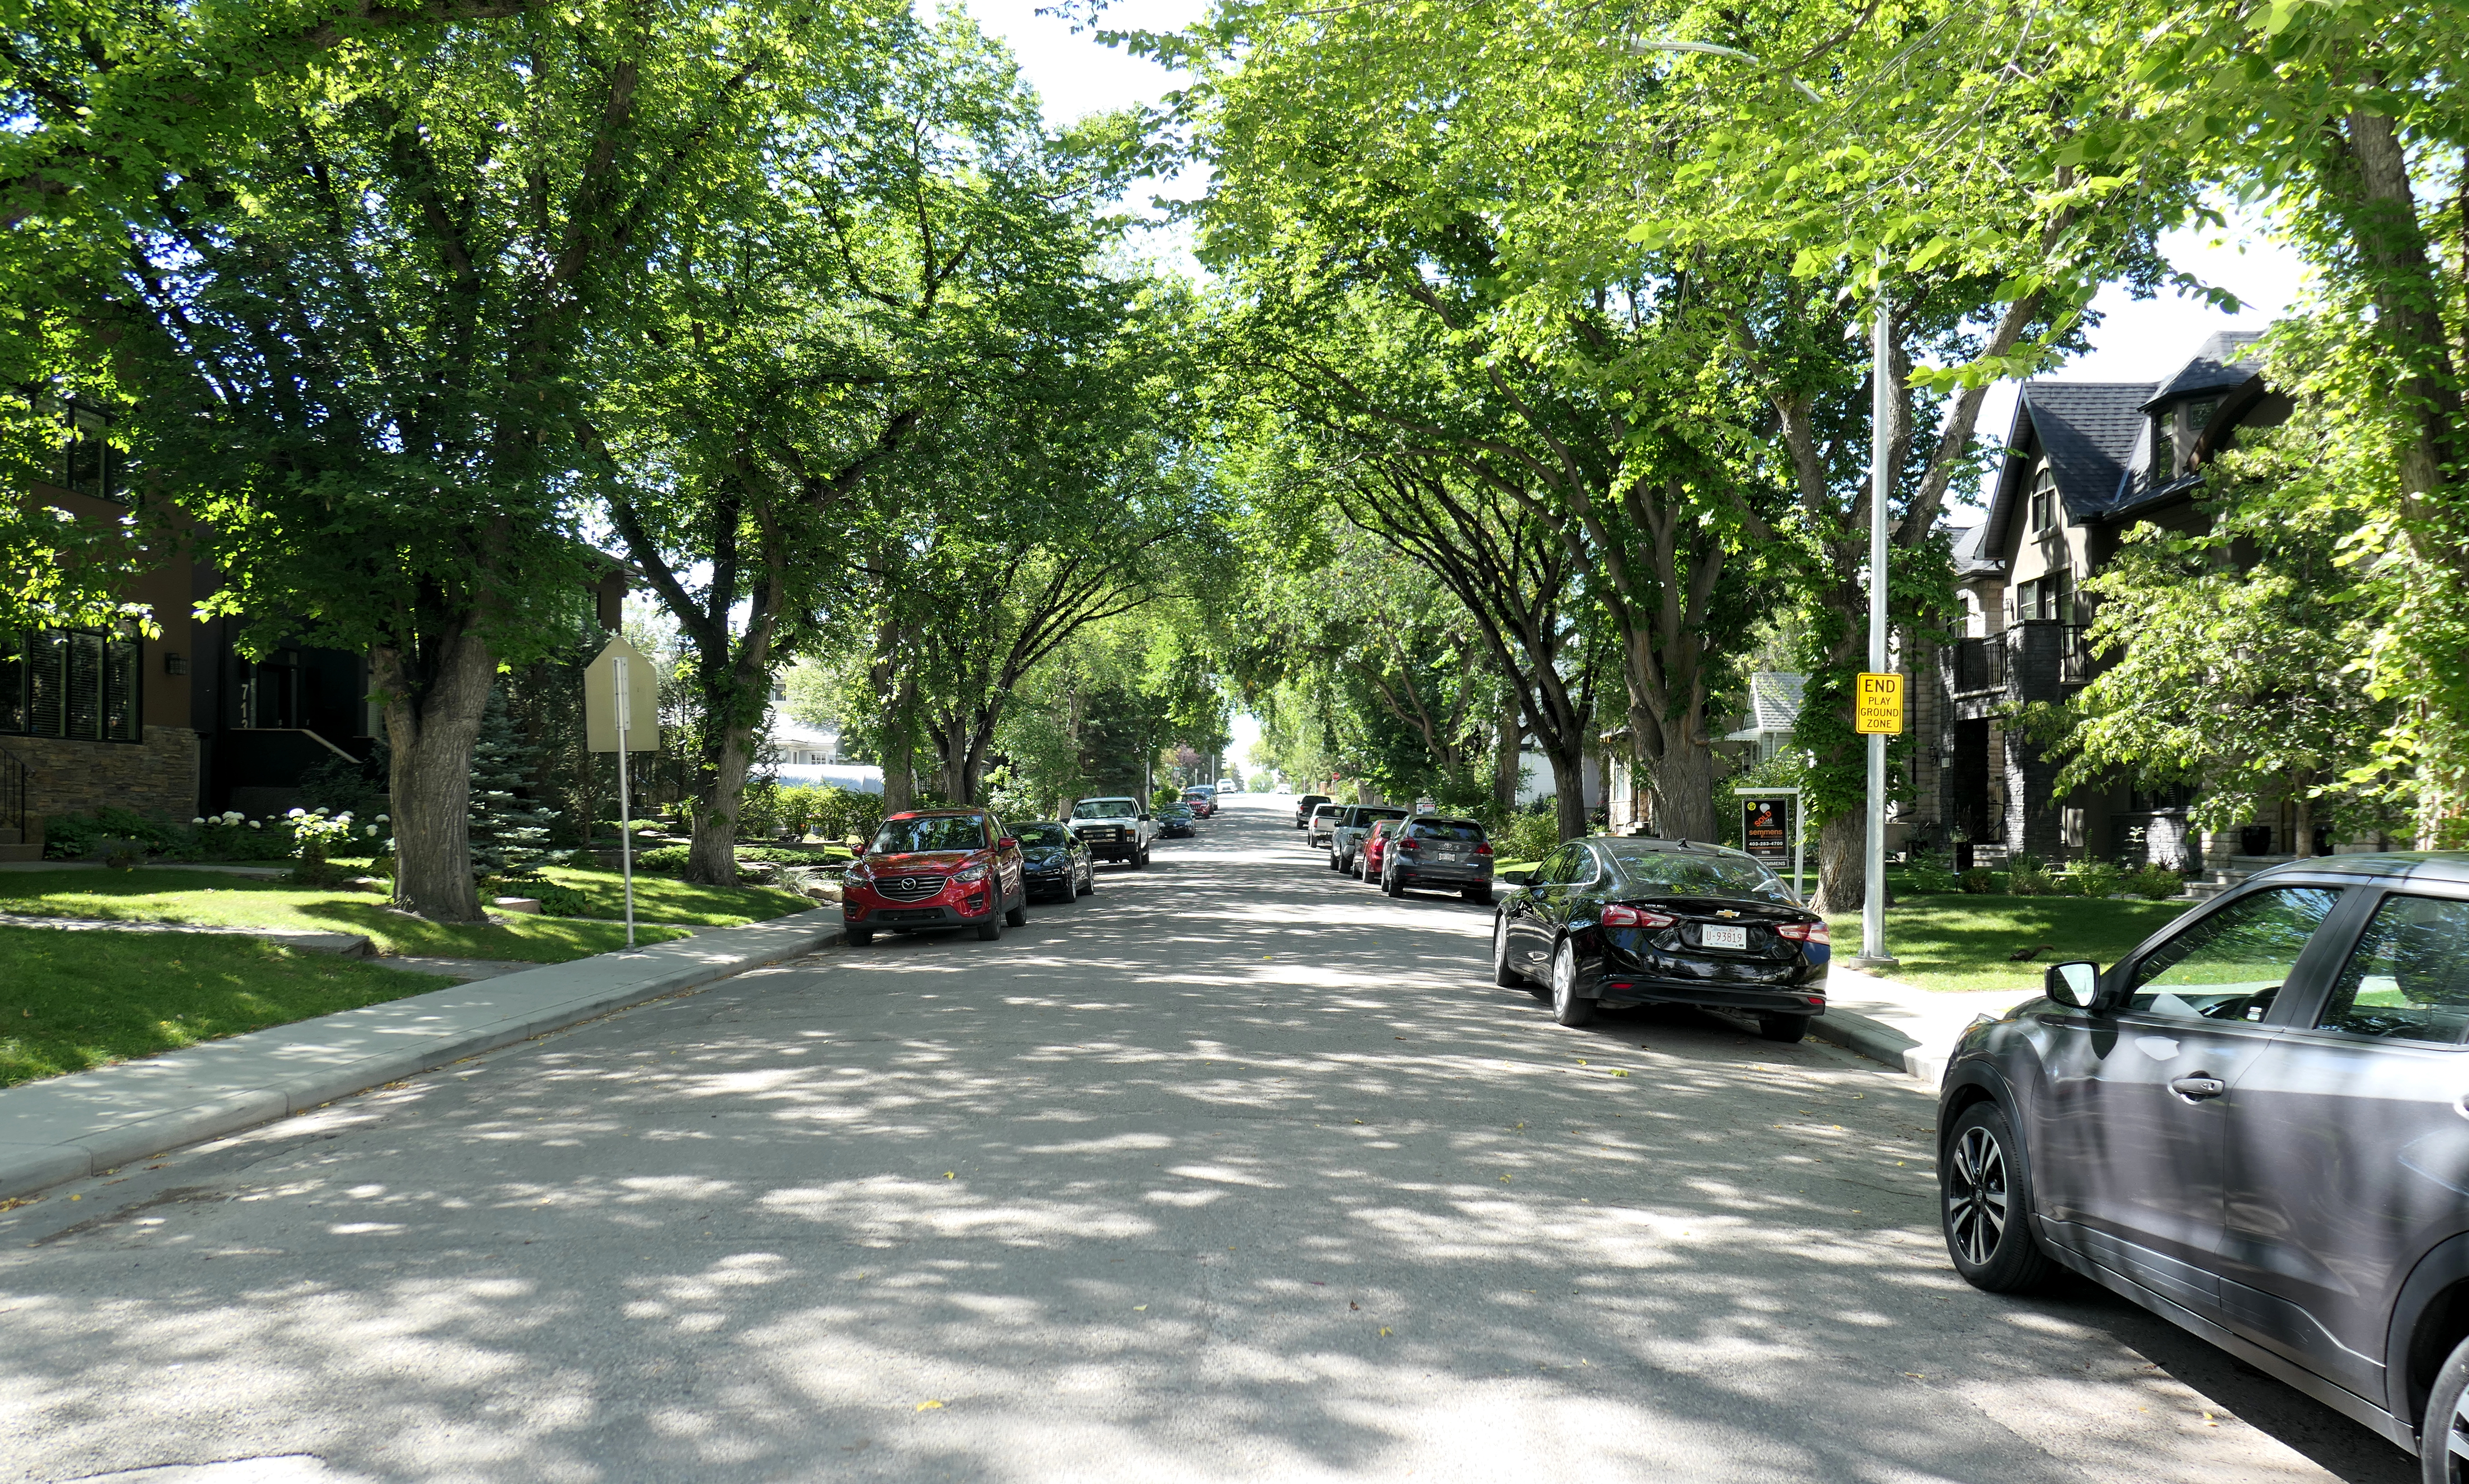 Pre WWII developments in Calgary (community of Mount Pleasant shown above) nurtured a diverse urban forest on prairie grassland that provide ample shade to homes.
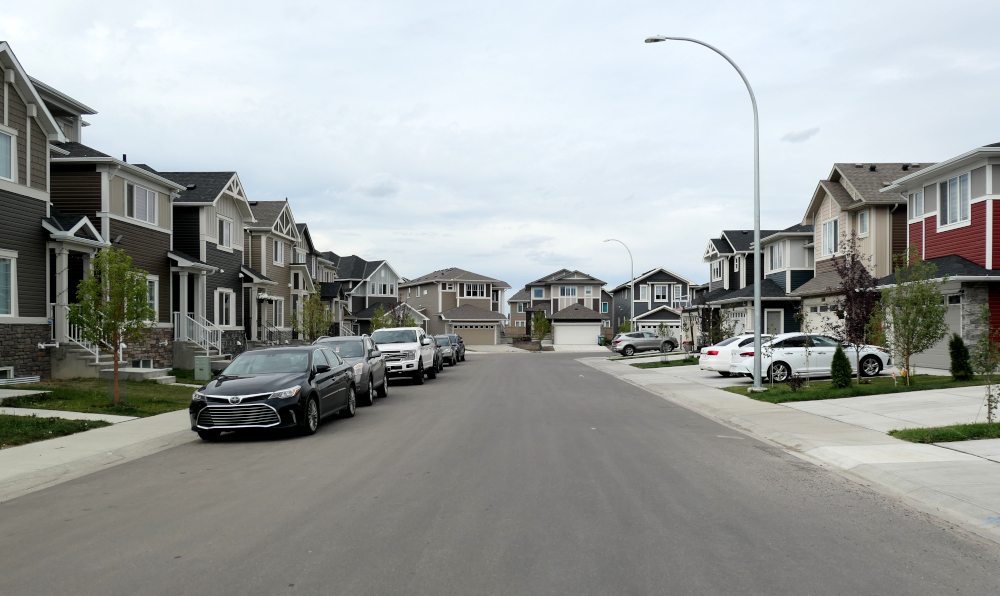 Typical suburban developments with front driveways and small lot sizese (Saddleridge shown above) lack sufficient permeable surfaces to support tree growth.
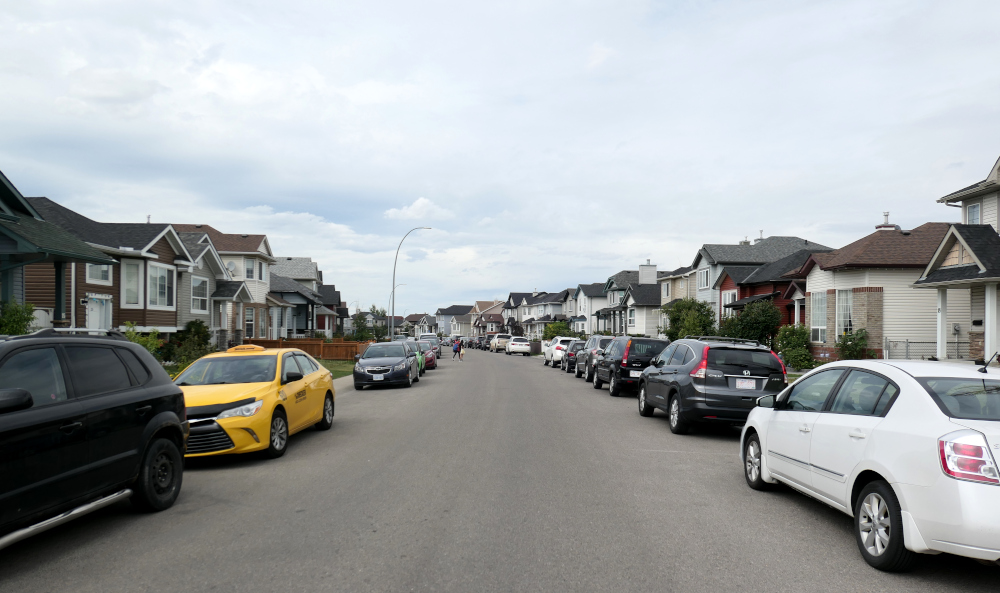 At over 10 years old, the community of Saddleridge (shown above) in Calgary still has areas with less than 1% tree cover. This area of Calgary also has some of the highest immigrant populations.
Mapping Tree Cover using Three Data Sources
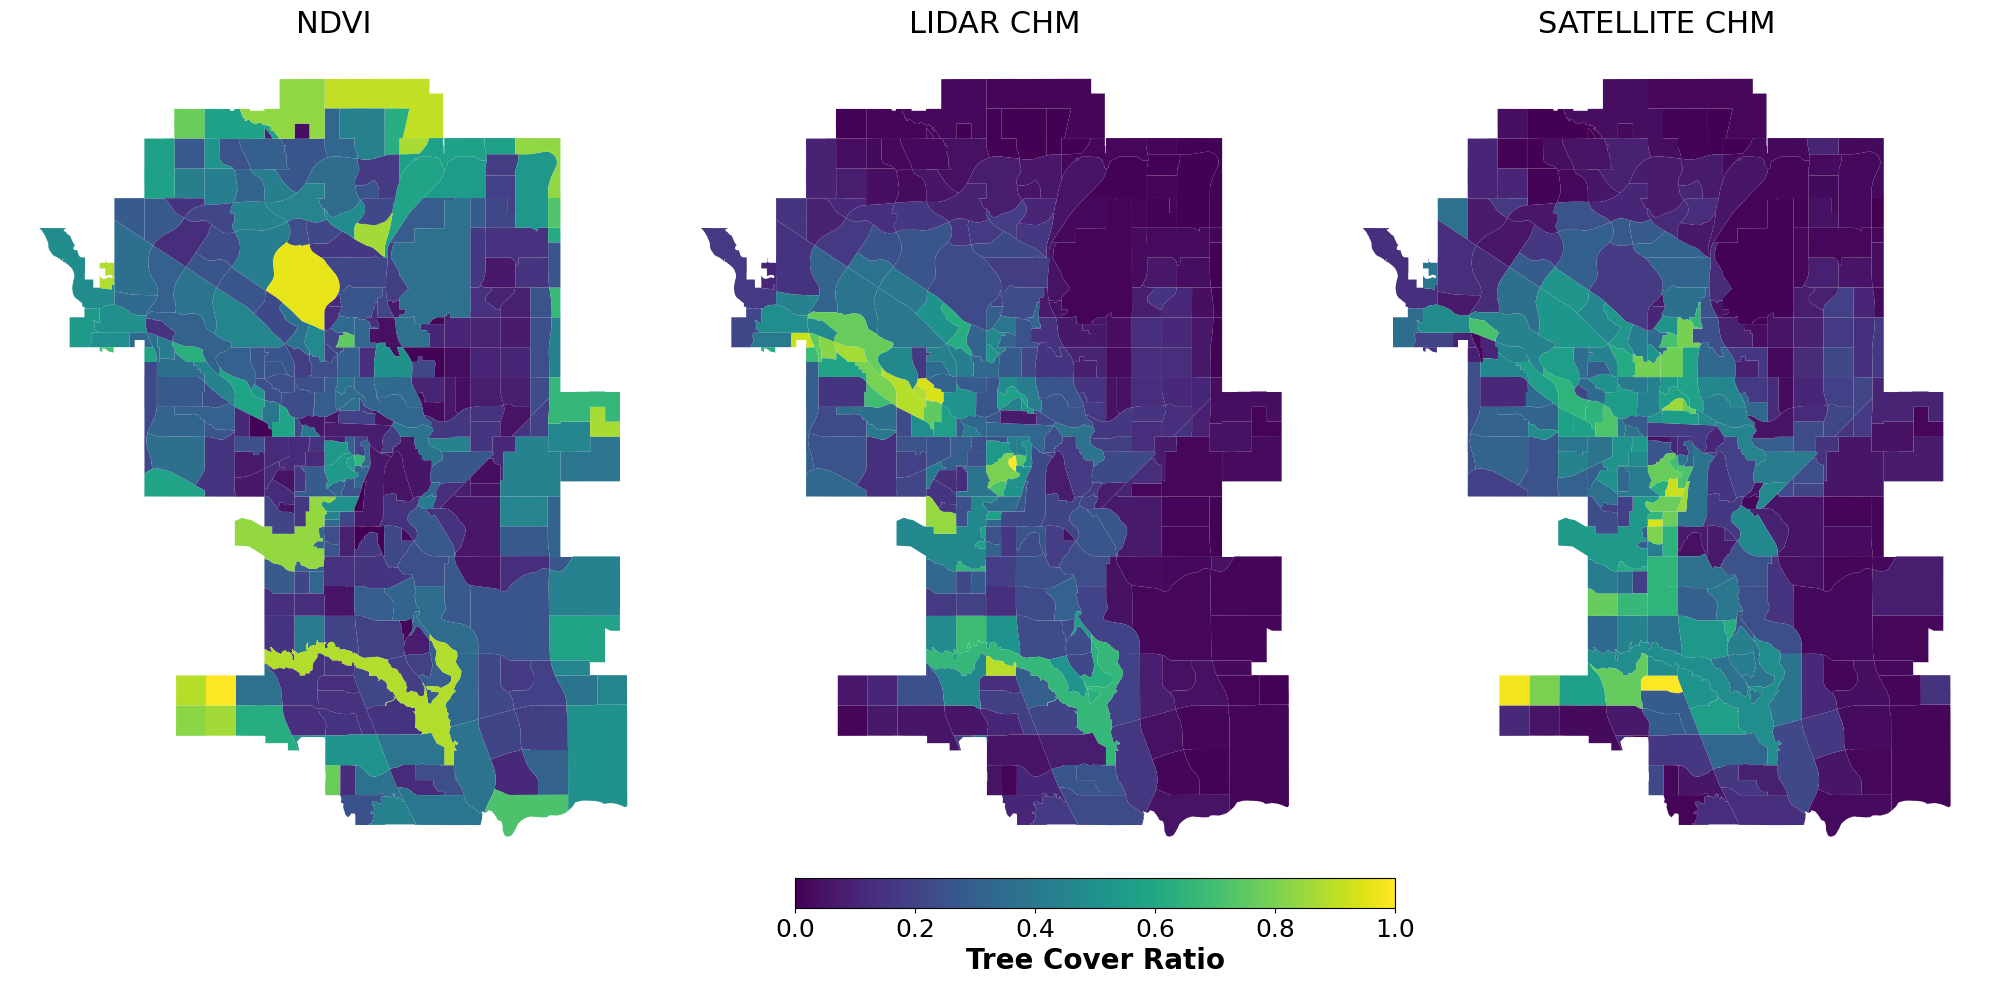
With the crucial need for tree canopy cover data, using it to ultimately understand tree equity in the city, I wanted to compare determining tree cover in Calgary using three available data sources: Satellite data NDVI, Satellite data Canopy Height Model (CHM) and LiDAR CHM. Each of these sources have different resolutions and therefore will produce varying accuracies.
Normalized Difference Vegetation Index (NDVI)
Normalized Difference Vegetation Index (NDVI) is a commonly used and simple to calculate measure of the “greeness” of an area which correlates to the quantity of vegetation. This can sometimes be used as a proxy for tree cover, however accuracy depends on the biome of the area of interest. This measure is calculated by a ratio of infrared and colour optical bands which can be obtained from medium resolution satellites such as Landsat-8 or Sentinel-2. Both Landsat-8 and Sentinel-2 sources are accessible via a modern metadata standard called STAC. The NDVI ratio can be thresholded to filter out the most green areas.
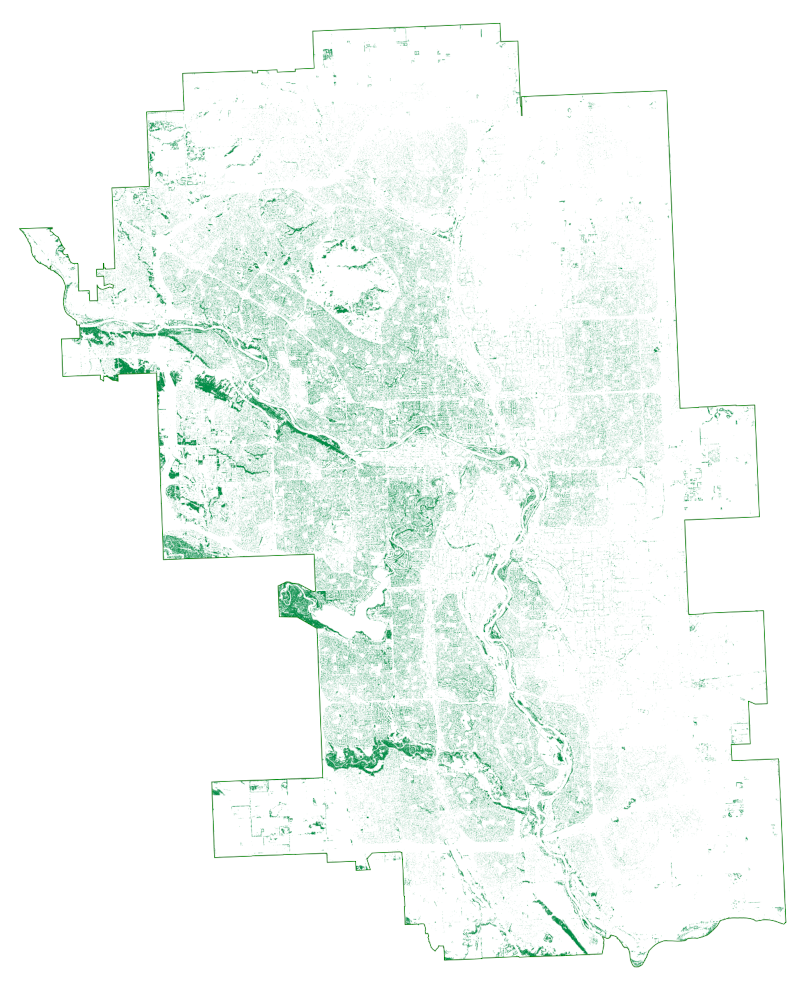
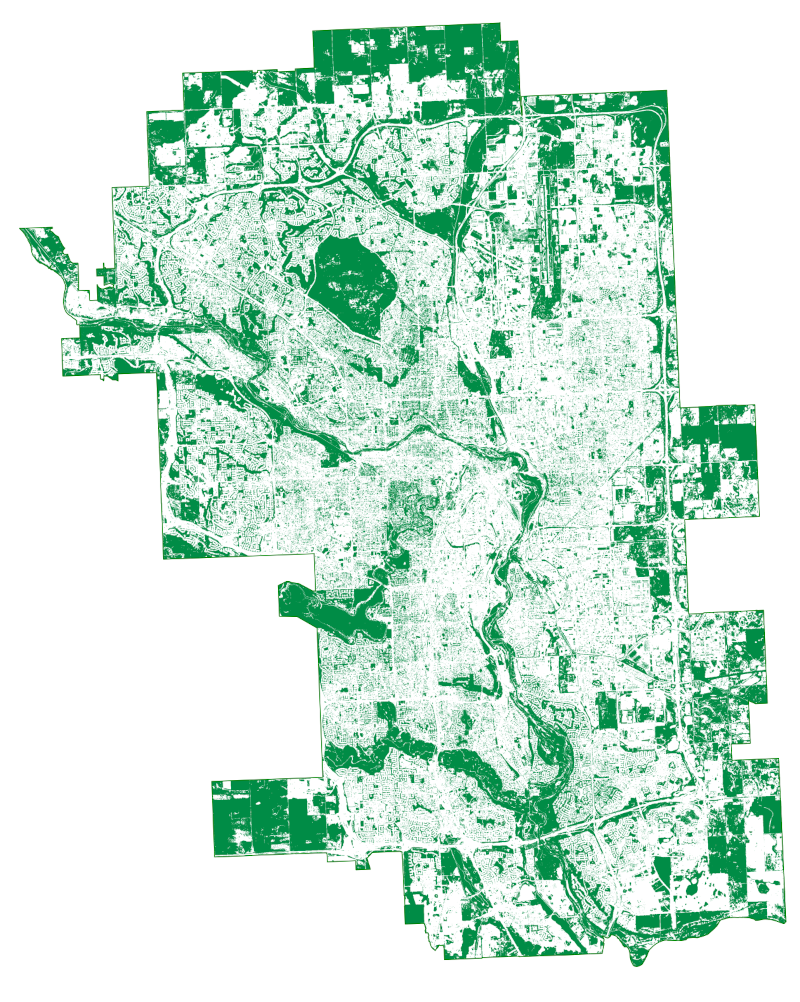 Above: NDVI using mosaic Sentinel-2 satellite imagery between Aug 1 and Aug 30 2022. A complete Sentinel-2 mosaic of Calgary was not available for 2020.
Alhough NDVI will pick up greeness from the tree canopy, it will also classify grassland in the same way. If we use this as a proxy for tree cover, then we may over estimate the canopy since some grassland areas may not have any trees. This can be seen the outer undeveloped suburban areas of the map above which shows undeveloped grassland areas that we know contain no trees.
Canopy Height Model (CHM)
A canopy height model helps is used to represent the height of trees by calculating the distance between the ground and tops of trees. The CHM can be generated by using LiDAR and subtracting a digital terrain model (DTM) from a digital surface model (DSM). LiDAR is a form of active remote sensing where lighting emitted from a rapidly firing laser reflects off buildings, trees, structures or the ground and returns to the sensor and can help measure the height of these features with extremely high resolution. Despite the high accuracy of LiDAR it is expensive to deploy and because of this usually covers a limited geographic area.
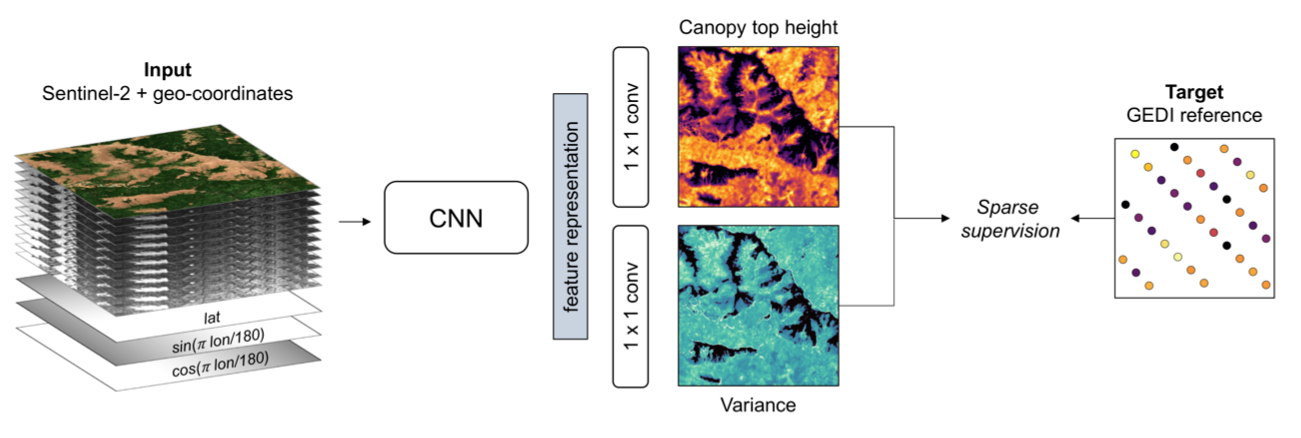 Above: Deep learning architecture fusing Sentinel-2 and GEDI data from Lang et. al, 2022.
Recently, there has been a growing area of research that combines different satellite data sources along with deep learning to gather global scale CHM, although at a lower resolution than what’s achievable with LiDAR. In 2022 researchers at KTH developed a probabilistic CHM that fuses satellite mounted LiDAR using NASA’s GEDI program with optical satellite images from the European Space Agency’s (ESA) Sentinel-2 (Lang et. al.). The result is a global scale CHM at a resolution of 10m. Meta Research also released a CHM deep learning architecture using Maxar high resolution optical satellite imagery, LiDAR CHM and GEDI data. The result is a scalable CHM with a resolution of 0.5m.
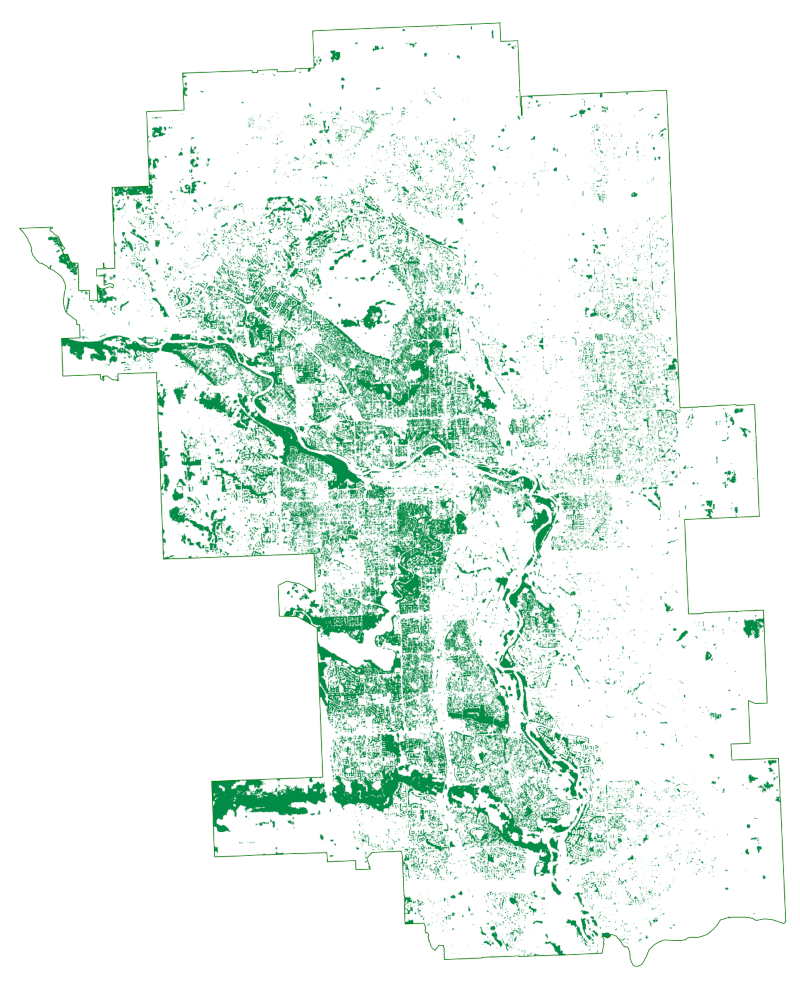 Above: Satellite Data CHM using 2020 Sentinel-2 and GEDI data (Lang et. al, 2022). The 10m resolution from satellite data results in chunkier blocks of tree canopy with less accuracy that LiDAR CHM.
For the Calgary tree canopy, I was able to gather two CHMs. One 2020 LiDAR data product from the City of Calgary Open Data portal and another from the Lang et. al hosted on Google Earth Engine. Both results are better able to classify grassland areas with low tree count compared to the NDVI method. The Satellite CHM is not as accurate as LiDAR and has considerable differences in some areas.
 Above: LiDAR CHM using 2020 data from City of Calgary Open Data. The high resolution of the data shows a finer depiction of the tree canopy.
Tree Cover by Community
By doing a comparison on the tree cover by community we can see how each of the methods compares. The tables below show the ten highest and ten lowest tree cover neighbourhoods ordered by the LiDAR CHM. The CHM methods (LiDAR and Satellite) more accurately convey the tree cover in the grassland areas compared to NDVI. Satellite CHM performs better at detecting low tree cover however performed poorly at high tree cover ares.
Lowest Canopy Cover by Community
| Community Name | CHM (LiDAR) | CHM (Satellite) | NDVI |
|---|---|---|---|
| Cornerstone | 0.27% | 1.78% | 52.58% |
| Redstone | 0.63% | 2.31% | 22.31% |
| Skyview Ranch | 0.108% | 2.03% | 23.31% |
| Sherwood | 2.446% | 1.61% | 34.78% |
| Saddle Ridge | 2.50% | 1.37% | 19.08% |
| Taradale | 2.72% | 4.24% | 19.67% |
| Coral Springs | 3.16% | 7.96% | 28.78% |
| New Brighton | 3.70% | 0.96% | 21.81% |
| Kincora | 4.76% | 4.40% | 43.91% |
| Country Hills Village | 4.99% | 8.35% | 29.79% |
Highest Canopy Cover by Community
| Community Name | CHM (LiDAR) | CHM (Satellite) | NDVI |
|---|---|---|---|
| Rideau Park | 86.78% | 54.30% | 56.71% |
| Parkdale | 81.38% | 26.99% | 27.72% |
| Shawnee Slopes | 77.46% | 37.58% | 19.81% |
| Wildwood | 77.28% | 50.86% | 57.43% |
| Point McKay | 76.42% | 16.45% | 52.01% |
| Medicine Hill | 74.99% | 35.01% | 61.91% |
| Lakeview | 73.14% | 17.82% | 24.48% |
| Elbow Park | 69.40% | 59.96% | 53.71% |
| Patterson | 68.88% | 43.44% | 45.51% |
| Bowness | 66.56% | 50.43% | 33.62% |
References
Lang, N., Jetz, W., Schindler, K., & Wegner, J. D. (2022). A high-resolution canopy height model of the Earth. arXiv preprint arXiv:2204.08322
Dandridge, L. (2023). Trees and Urban Heat. https://www.youtube.com/watch?v=pXL_P_Ffcg0&t=1979s